Track Record, how accurate prediction markets have been
The Track Record page answers the question behind every number on Predictions: when the markets said 70%, how often did it happen? It checks the markets that have settled against the chance traders gave each outcome the day before they closed.
#Open Track Record
Select Track Record in the row of Predictions pages. The Resolved page links to it too.
#What the page shows
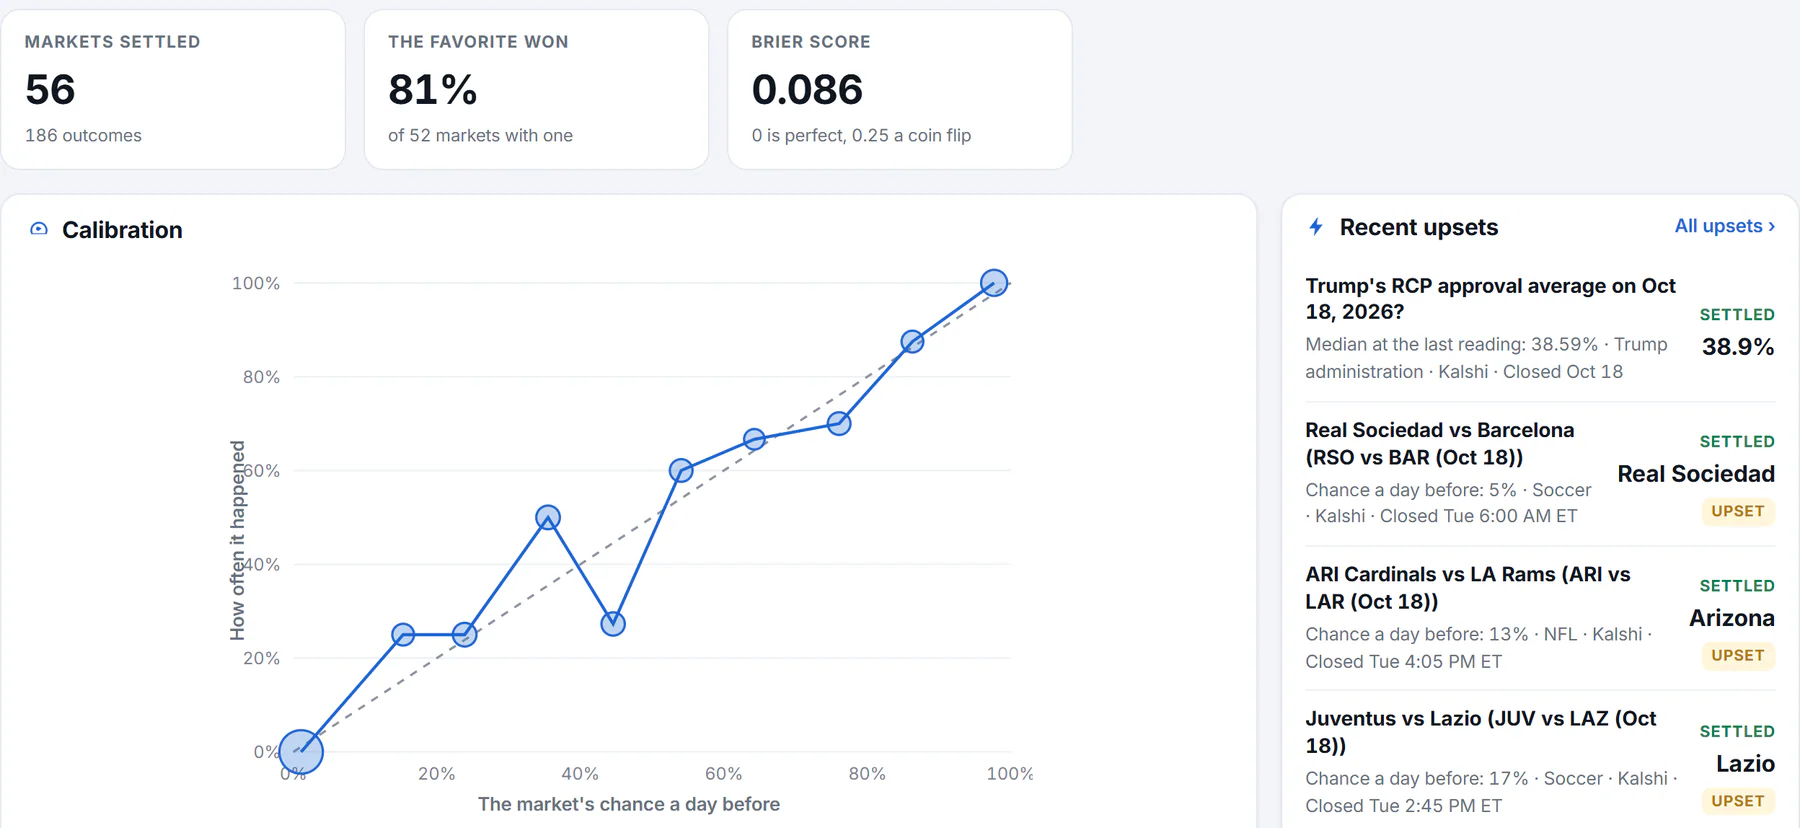
The record so far: three headline figures and the calibration chart. The numbers change as more markets settle.
- 1How many markets it covers
- 2How often the favorite won
- 3Brier score: 0 is perfect
- 4Calibration: the dashed line is a perfect market
The three tiles at the top summarize the record.
- Markets settled is how many settled markets the record covers, with the number of outcomes behind it. Each outcome counts once.
- The favorite won is how often the answer that was ahead a day before, with a chance of 50% or more, went on to win, and out of how many markets that had a favorite.
- Brier score measures how far the chances were from what happened, on a scale where 0 is perfect and 0.25 is what a coin flip would score. Lower is better.
Below the tiles, the Calibration chart compares what markets said with what happened. Each dot is a tenth of the scale: 0 to 10%, 10 to 20% and so on. A dot's position across is the average chance the markets gave, and its height is how often those outcomes happened. A dot's size is how many outcomes it holds.
The dashed line is a perfect market, where things priced at 70% happen 70% of the time. A dot above the line means the outcomes happened more often than the chance said, and a dot below means less often. A small table under the chart lists the same numbers for each tenth.
Further down, By topic and By venue show the same measures for each group, with the outcomes counted, the Brier score and how often the favorite won. A group appears once it has at least ten outcomes. Recent upsets lists results from the last few weeks that traders gave under 30%, and How this is measured repeats the method.
#How it is measured
Each outcome of each settled market is one forecast: its chance a day before the market closed. Whether the outcome happened is the answer. If a market had been followed for less than a day, its last reading is used.
Only yes-or-no questions and questions with a single winner are counted. Price ladders, where several levels "happen" at once, are not. Thin markets are left out. The record covers the markets 4Search followed through to their results, so it grows with time. Until it has at least 30 forecasts, the page says Building the record instead of showing a chart.
#Common questions
What does a Brier score of 0.1 mean?
The chances were, on average, close to what happened. A score of 0 would mean every outcome was priced at 100% or 0% and went the way it was priced. A score of 0.25 is what you would get by calling everything 50%.
Why is a topic or venue missing from By topic?
A group needs at least ten outcomes before it is listed.
Does a dot below the dashed line mean the markets were wrong?
It means that, for that tenth of the scale, the outcomes happened less often than their chances said. With few outcomes in a tenth, a dot can sit off the line by chance.
Is the record for all prediction markets?
No. It is for the markets that 4Search followed to a result, and only the kinds described above.